EFFECTS
Wave Candy
Wave Candy is a flexible audio analysis and visualization tool which includes an Oscilloscope, Spectrum Analyzer, Vectorscope and Peak Meter.![]() Video Tutorial here.
The display type, colors, frequency range and dynamic range are all fully customizable. Related plugins include Spectroman,
dB Meter & Fruity Dance.
Video Tutorial here.
The display type, colors, frequency range and dynamic range are all fully customizable. Related plugins include Spectroman,
dB Meter & Fruity Dance.
NOTE: Right-click any of the output display to change the display type.
How to use
Load Wave Candy into an effects slot on the Mixer Track to be monitored. A good place to load Wave Candy is on the special 'Current (C)' Mixer track located to the left of the 'Master' track. The 'Current' Mixer track receives audio from any selected track (as the name suggests). Audio from any track that Wave Candy is loaded into drives the plugin visualizations.
Lower Tabs & Controls
- Oscilloscope
- Spectral Analyzer
- Metering
- Vectorscope
- Auto visual mode - Changes the display type based on the size and shape of the window. For example, making the display tall and narrow will select 'Peak meter' mode while making it short and wide will select 'Oscilloscope" mode.
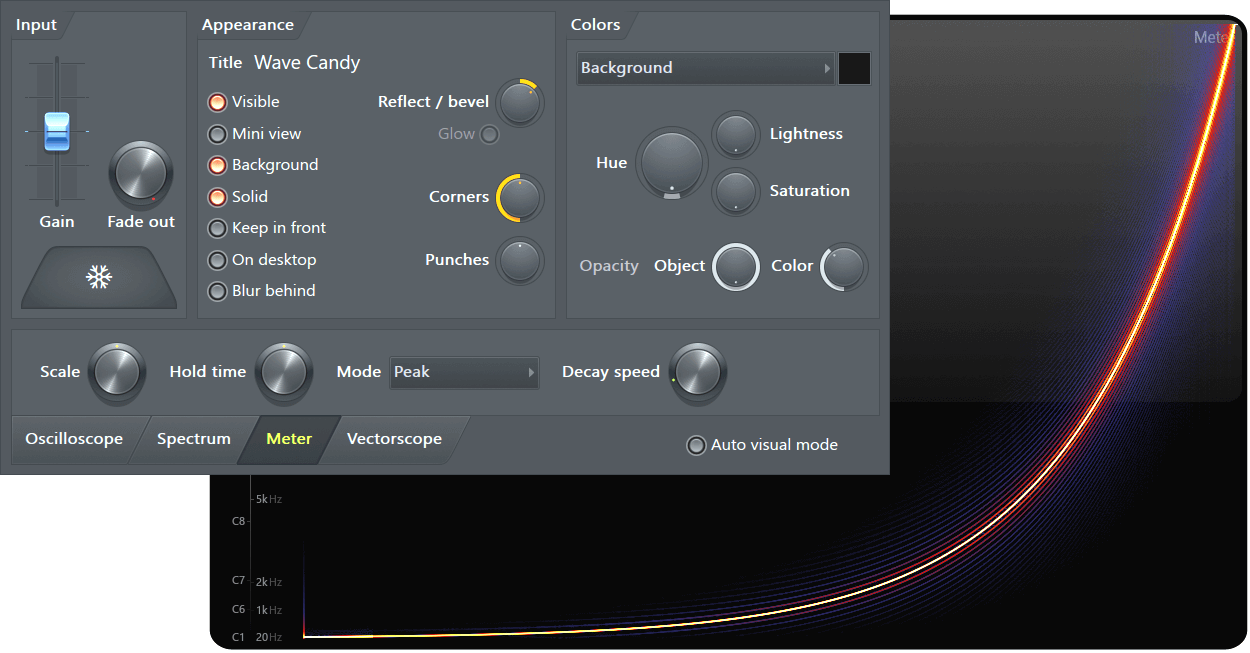
Parameters
Input
- Gain - Increases (right) or decreases (left) the display gain. NOTE: if you change this value any dB values shown by Wave Candy will be relative to the input level.
- Fade out - Sets the delay between input stopping and the display fading from view. This only works if the background is also turned off (see the Appearance controls below).
- HOLD - Freezes the current display. Click a second time to return to normal operation.
Appearance
- Title - Click to edit the display title.
- Visible - Turns the display window on or off.
- Mini view - Selects an alternative small display.
- Background - Shows/hides the display window background.
- Solid - When selected, you can use Left-click to move and resize the display (depending on where clicked) and Right-click to open the display menu. When deselected, Wave Candy will be transparent to mouse clicks and you can work on applications behind it.
- Keep in front - Keeps the display window on top of any open application.
- On desktop - The display window will continue to be visible on the Windows desktop after the host application has been minimized.
- Blur behind (VISTA) - Blurs anything behind Wave Candy's transparent display window, in Vista & Windows 7.
- Reflect / bevel - Turn right to change the reflection level, or left to hide the reflection and change the width of the display window bevel (surround).
- Corners - Corner 'rounding' control.
- Punches - Displays/hides background decorations, known as 'punches'.
Colors
- Color target - Drop-down menu provides targets for the color adjustment controls. Once selected, a color can be changed by clicking
on the box to the right of the menu, to open the color chooser.
- Frame - Displays window frame related colors.
- Bevel - Bevel (outer frame) related colors.
- Glass - Glass effect related colors.
- Text - Text related colors.
- Helpers - Helper related colors.
- Oscilloscope - Oscilloscope related colors.
- Spectrum - Spectrum related colors.
- Peak meter - Peak meter related colors.
- Vectorscope - Vectorscope related colors.
- Eye candy - Special lighting effect colors.
- OA (Object opacity) - Turn to the right to increase the target variable opacity.
- CA (Color opacity) - Turn to the right to decrease color transparency.
- H (Hue) - Cycles through the color spectrum.
- L (Lightness) - Turn to the right to increase lightness (washes out the color).
- S (Saturation) - Turn to the right to increase color saturation or density.
Hint: Wave Candy has been designed so that tweaking the color targets will create pleasing effects. This may make it a little difficult (if you are new to the plugin), to see exactly which color you are working with. Turn AO (object opacity), CA (color transparency) and S (saturation) all the way to the right, so that changes to H (hue) will be clearly visible. But its gaudy, so put them back when you are done. We shudder to think what visual disasters you will create once you discover these controls. On second thoughts, perhaps we should hide them.
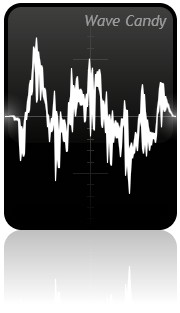
Oscilloscope
|
Displays the wave form created by the audio signal.
|
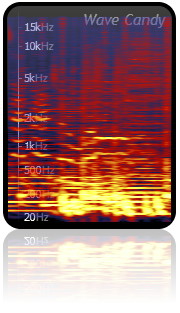
Spectrum
|
Displays a moving trace of the audio signal. Color hue represents intensity (level), vertical position represents frequency (20 Hz to 20,000 Hz, bottom to top is represented) and horizontal position represents time.
|
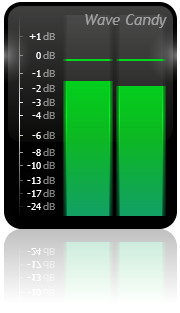
Meter
|
Displays the audio level as a pair of vertical bars (left and right channels) on a dB scale.
|
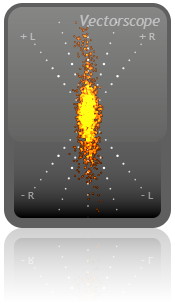
Vectorscope
|
The Vectorscope measures the differences between the left and right channels of a stereo input and can provide information about stereo content, panning and phase. The display requires some additional explanation: The flying spot - follows the positive and negative amplitude oscillations of the left and right input waveforms. The stereo channels share the spot by having their amplitude axes orthogonal to each other, so 'vectors' are created between the two channels, hence the name Vectorscope. It sounds a bit complex but is really quite simple, think of the display as an oscilloscope-style graph where one axis (+R/-R) represents the right channel amplitude and the other axis (+L/-L) is the left channel amplitude. The technical name for the visual display on a Vectorscope is a Lissajous figure (as shown left). Left, Right & Mono signals - When fed a lone left or right channel input, a straight line is generated as the spot bounces up and down along the input axis (the dotted +L/-L or +R/-R grid). A left channel input will generate a line sloping to the left, while a right channel input generates a line to sloping to the right. A mono input, panned to center, will generate a vertical line. This is the 'vector' between the left and right channels. By observing the orientation of the line OR general orientation of a 'Lissajous figure', the display will give a visual indication of the average pan position. NOTE: The background grid shows center pan, 50% pan and 100% pan for left and right). Stereo - Stereo is created by amplitude differences between the left and right channels, so stereo signals cause the display to deviate from the vertical line, creating a 'Lissajous figure '. The more 'stereo' content the signal has, the more complex and 'fatter' the Lissajous figure will be. Thin figures mean there is low stereo content (lines mean there is no 'stereo' effect and indicate pan position). Phase - If a straight line, or Lissajous figure, appears oriented along the horizontal axis this indicates that left and right channels are 180° out of phase. Note that the more stereo content the signal has the more difficult it will be to see the orientation of the 'Lissajous figure'. Options
NOTE: If you want to use the plugin to create visual effects, try sine-wave sounds (Sytrus 'Default' for example) with phasing or flanging added. Two note chords will add another layer of complexity. Generally, keep the input simple and you will be rewarded with the most coherent and beautiful Lissajous figures. But it's not a toy, get back to work and improve your mix! |
Output Display Menu
Right-click any of the above output display to open this menu. Note that the appearance setting 'solid' must be on for the mouse action to be effective.
- Window
- Visible - Turns the display window on or off.
- Mini view - Selects an alternative smaller display.
- Background - Shows/hides the display window background.
- Mode
- Auto - Changes the display type based on the size and shape of the window. For example, making the display tall and narrow will select 'Peak meter' mode while making it short and wide will select 'Oscilloscope" mode.
- Oscilloscope - Displays the wave form created by the audio signal.
- Spectrum - Displays a moving trace of the audio signal. Color hue represents intensity (level), vertical position represents frequency (20 Hz to 20,000 Hz, bottom to top is represented) and horizontal position represents time.
- Peak meter - Displays the audio level as a pair of vertical bars (left and right channels) on a dB scale.
- Vectorscope - Displays information about the differences between the left and right audio channels (stereo effect).
- View settings - Opens the Wave Candy control panel.
Hints
Hold your mouse pointer over the display allows you to inspect the levels under the pointer. The middle mouse button freezes the display (same as HOLD). CPU load: In general, CPU increases with increasing display size.
Plugin Credits
Code & GUI: Didier Dambrin.