FL Studio Mobile
Analyzer
Use the Analyzer module to visualize important aspects of your music including the Frequency Spectrum, Waveforms (Scope), Loudness (according to various standards), Stereo imaging and Pitch.
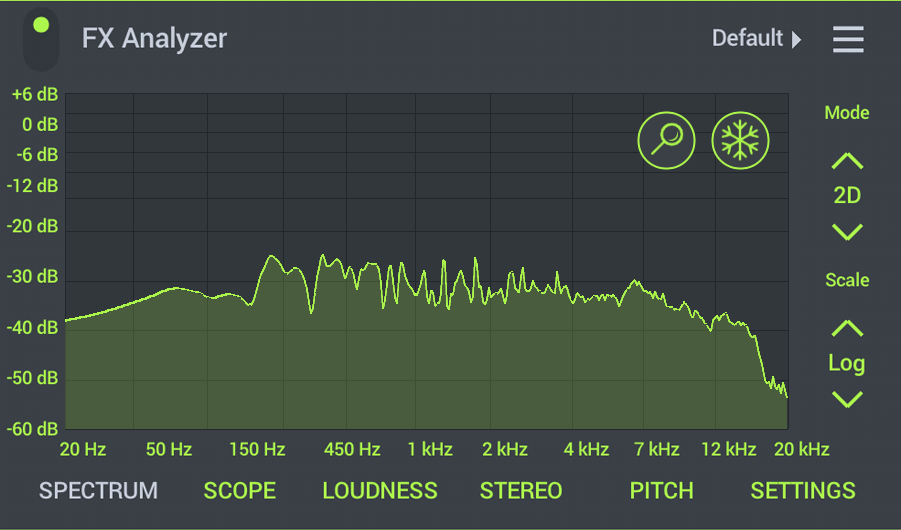
Select visualizations by tapping the labels below the display. Where available, the Magnifying Glass icon allows you to zoom in on specific area of the display. The Freeze icon stops motion so you can better see transient details. The controls to the right will change depending on the visualization as explained below.
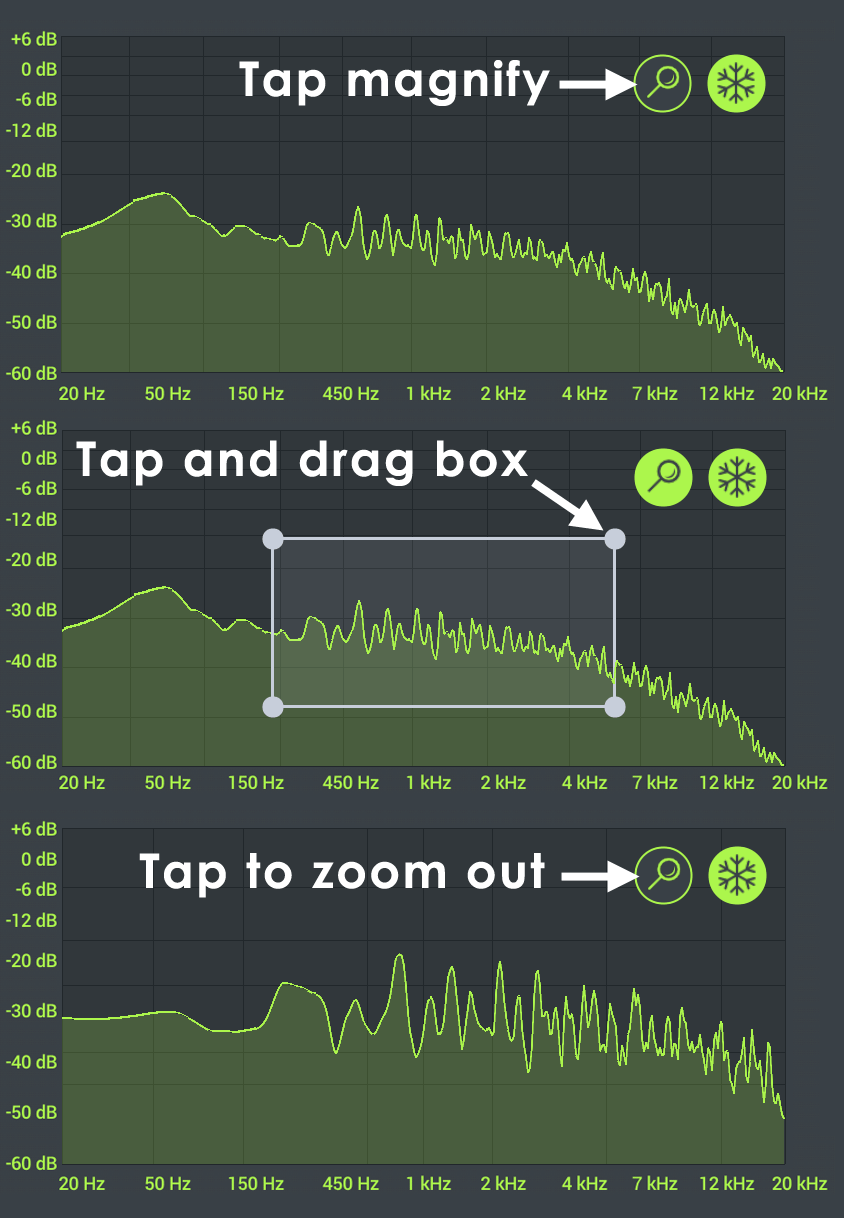
Some displays will allow you to Zoom or Inspect points:
- How to zoom - Tap the magnifying glass icon to enter Zoom mode. The white rectangle shows the current zoom area. Drag the circles (handles) on the corners to change the size of the zoom area. Tap in the middle and drag the rectangle around to change the position of the zoom area. Double-tap to reset zoom to default. Double-tap again to reset zoom to maximum value. Double-tap, yet again, to reset zoom to your custom value.
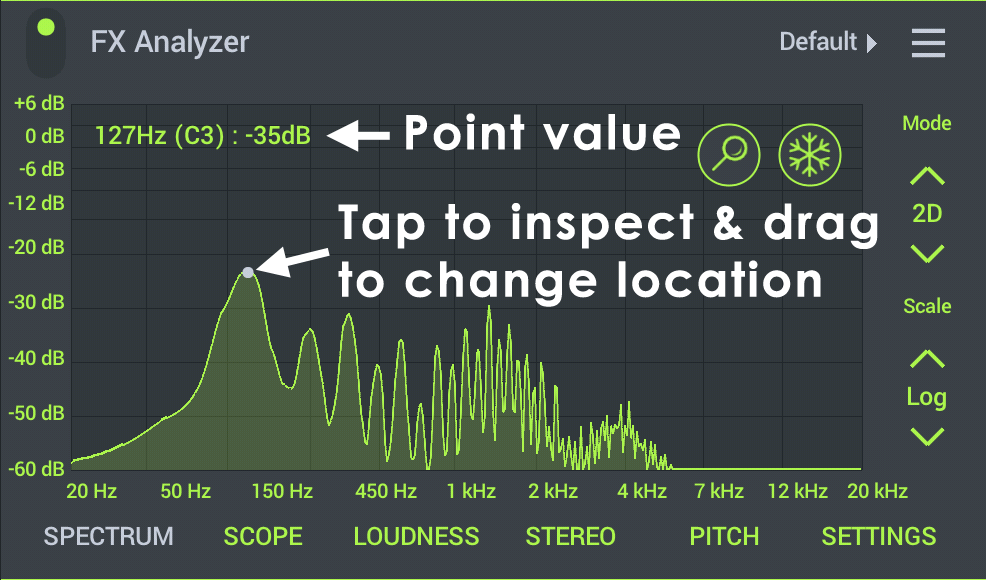
- On inspection points - Drag your finger left or right on the graph to see the value of the function at any point. You don't need to be on the display lines, just inside the graph area. The spot-marker will follow the curve at the position of your finger. To remove the marker - simply swipe it off to the side of the graph.
Parameters
Spectrum
Displays peaks in the audio signal as a function of frequency (along the horizontal axis 20 Hz to 20 kHz). Tap the display and drag left/right to inspect a specific value at the desired location.
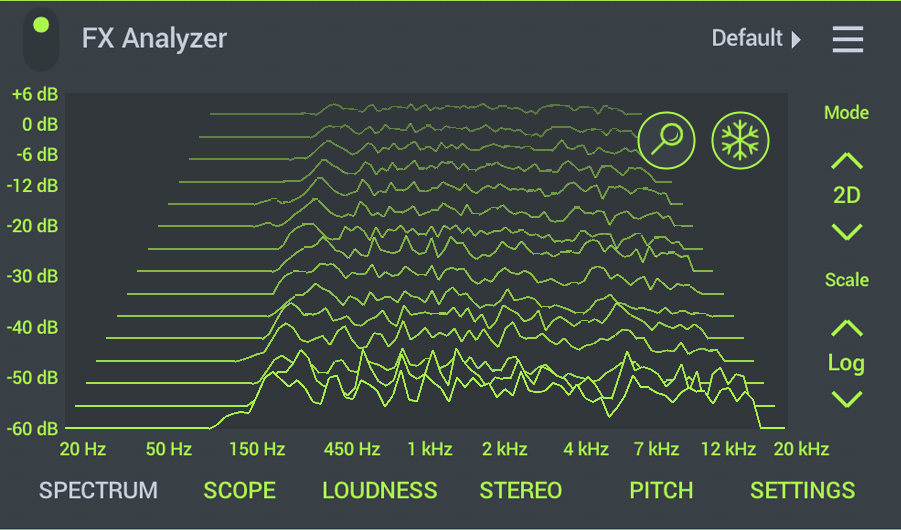
- Mode - Choose 2D or 3D views. The 3D view shows spectra over the last 5 seconds (rear-most).
- Scaling - Choose Logarithmic (which gives more detail to the lower frequencies) or Linear scaling for the Frequency axis.
NOTE: The spectrum uses a +4.5 dB/Octave scaling (crossing unity gain at 1 kHz) to increase the apparent level of the spectrum as frequency increases. That is, a 'true' flat frequency response will appear to rise in level along with frequency. If you mix for a visually flat response, this will de-emphasis higher frequencies and accentuate lower frequencies (bass). In this way, a frequency response that 'sounds' flat or balanced, will look more like it sounds. This system avoids the high end of a mix sounding too bright or harsh. As usual, we recommend mixing with your ears, not your eyes and to use this tool as a guide.
Oscilloscope
Shows the waveform created by the audio signal. The horizontal axis represents time, the vertical axis amplitude.
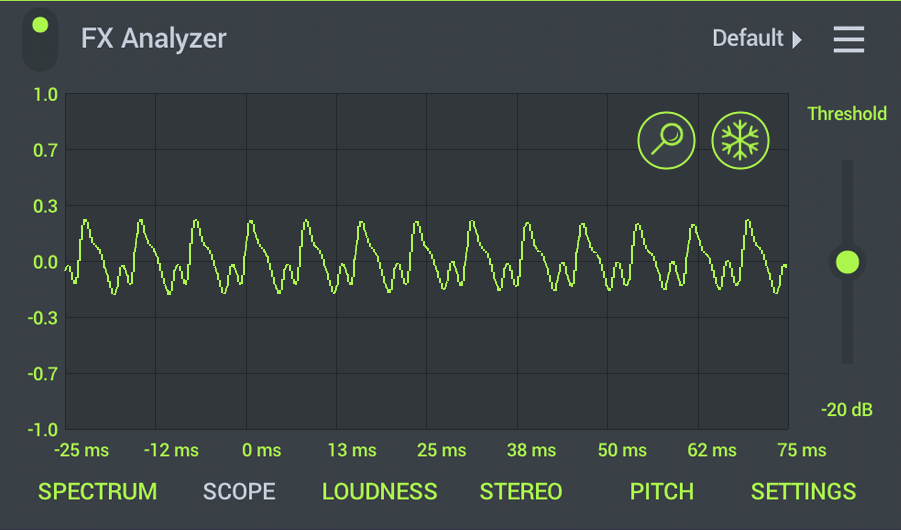
- Threshold - Lower values are better for visualizing musical content and higher values percussion.
- Time window - Tap the Zoom icon to enter the zoom mode and drag the circles (handles) to move the right-side vertical bar left or right. Move the window left to see more detail in the waveform (to inspect waveform shapes). Move Right to see more cycles in the waveform (best for percussion). The Trigger Point origin can be moved horizontally (in the first half of the zoom range window). This sets where 0 ms, the Trigger point, will be placed on the horizontal axis. Move it to the Right to see more of the waveform before the Trigger point and left to see more of the waveform after the Trigger point.
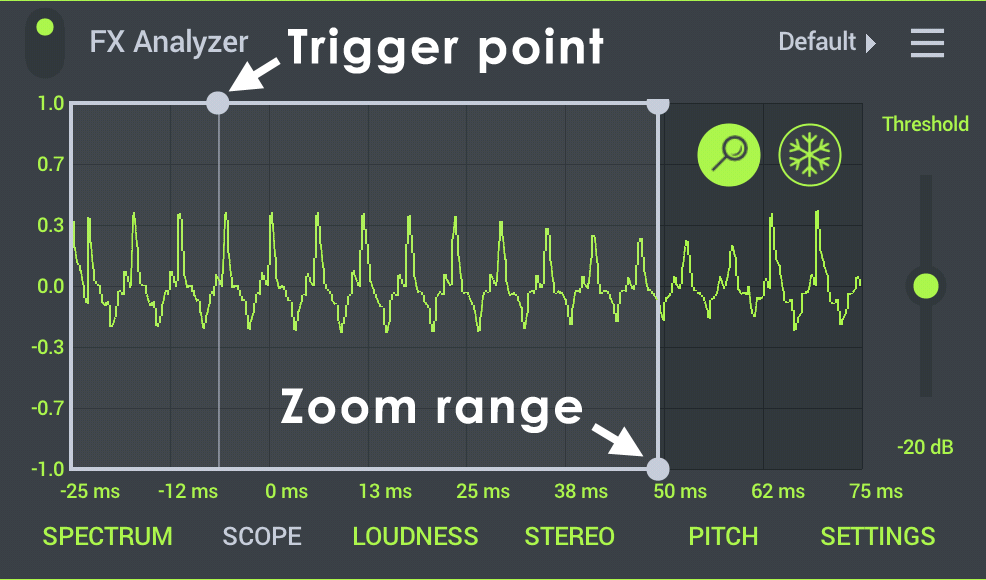
How triggering (synchronization) works - The display refreshes around 60 times per second. For each update the oscilloscope tries to align the waveform image of each successive frame, so the image appears stable. The oscilloscope uses a rising edge detection to perform that task. That is, a snapshot of the waveform is taken each time the threshold is crossed for the next window period. The level that triggers the detector can be set using the Threshold slider. The detected edge is aligned with the 0 ms mark on the x axis.
Loudness
Shows loudness according to several metering algorithms. Apart from 'Peak' and 'True Peak' all the other metering algorithms apply some 'average', 'weighted average' or 'secret squirrel mathematics' to better represent 'loudness' as perceived by humans (that's you).
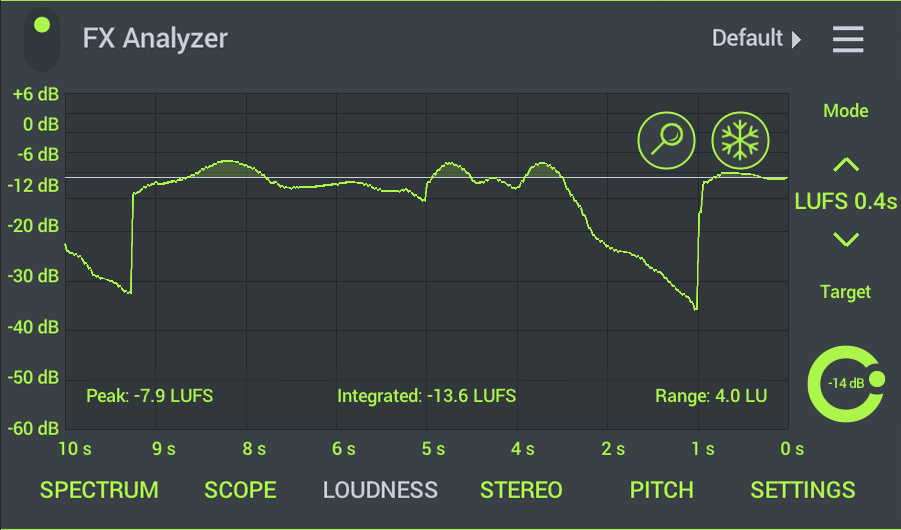
- On display summaries - The units shown will depend on the mode set. The values apply to the audio analysed while Playback is or was active.
- Peak - Maximum value.
- Integrated - Average value.
- Range - Maximum minus Minimum value.
NOTE: To reset values, select any another tab and back to LOUDNESS again.
- Mode - Choose between:
- LUFS 0.4s (Momentary mode) - Loudness Unit Full Scale with a 0.4 second integration (averaging) period. Values are represented as negative compared to full scale zero (0). As the LUFS value approaches zero your track will have less dynamic range and punchiness. There are no right and wrong answers here, as music levels are part of the 'art'. However, if you aim for somewhere between -12 and -10 dB (for the loudest parts of the track) you should retain good dynamics and with enough loudness.
- LUFS 3s (Short-term mode) - Loudness Unit Full Scale with a 3 second integration (averaging) period.
- What is LUFS? - LUFS (Loudness Unit Full Scale) is a synonym for LKFS (Loudness, K-weighted, relative to full scale), so you may see these terms used interchangeably. LUFS is 'simply' a modified peak level measurement. The input signal is equalized (filtered) to better represent human frequency sensitivity. That is, frequencies humans are most sensitive to, will contribute more to the measurement. Then, LUFS peak measurements are averaged over the track. In this way LUFS attempts to simulate the time and frequency characteristics of how the ear responds to sound pressure level. Of course, various arguments about what method best represents 'loudness' have broken out among audio and broadcast engineers, and LUFS was a response to these arguments designed to help broadcast entities deal with loudness variations that can upset listeners. LUFS is not magic, it is just an agreed industry standard for the apparent loudness of audio.
- How to use LUFS? - LUFS is widely used by 'broadcast' entities such as Television, YouTube, Spotify and iTunes. If everyone uses the same LUFS scale, and agrees on a target level, then it's easier to balance the apparent loudness of music and other audio, from a wide range of sources. Practically, audio levels are re-scaled to match LUFS targets, so successive tracks don't sound dramatically different in volume. For each platform using LUFS, if your track is above their LUFS target, they will turn it down. If it is below the target, they will turn it up. Since LUFS targets differ between broadcasters, we recommend Googling your specific interest, 'YouTube LUFS', for example. If you master your tracks with a given broadcast target in mind, it should be served untouched by the broadcaster during delivery.
- Perspective - LUFS targets vary between broadcasters and so this is not really something you should worry about, other than to know, if you master in the range -12 to -10 LUFS, your track is unlikely to be significantly adjusted by a broadcaster AND will probably retain good dynamics in its own right. As mentioned above, tracks with Integrated LUFS values between -10 to 0 dB will sound progressively over-compressed. That is, lack dynamics (changes in volume) and the percussion will lose transients (punchiness and snap on the attack).
- RMS (Root Mean Square) - The RMS calculation is performed over a 50 ms 'time window'. This moving average evens out transient peaks, to better represent loudness.
- Peak - Displays the precise and instantaneous level of the audio based on the actual sample data. Most useful for spotting clipping problems and seeing absolute maximum peak levels.
- True Peak - A more accurate version of Peak. Uses interpolation to display inter-samples peaks that can occur as a function of resampling. That is, the actual sample data does not always represent the true peak levels after a waveform is reconstructed from it.
- Target - Set the target level you want to achieve. This is a visual indicator for your reference.
Stereo Image
There are three displays allowing you to monitor the stereo width (Vectorscope), stereo interference (Correlogram) and panning (Balance) of the mix.
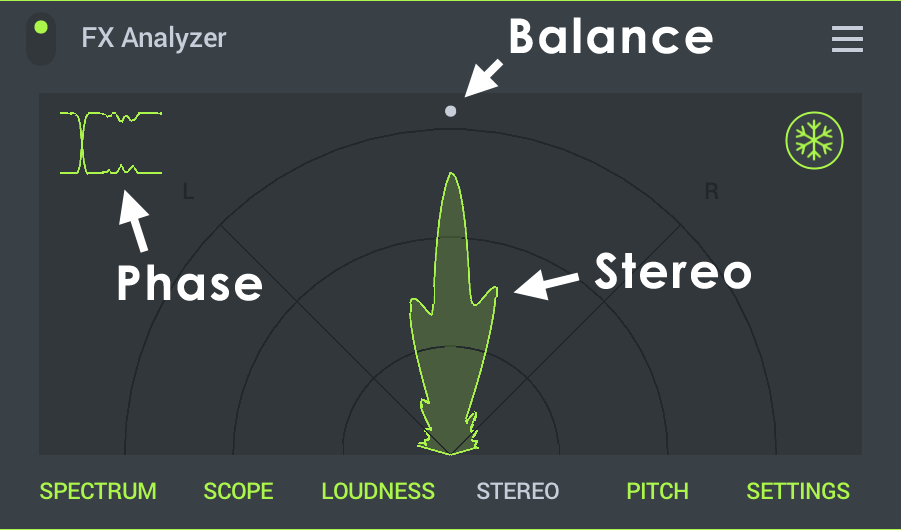
- Vectorscope - The central part is the vectorscope. The sound 'flower' shows stereo width of the audio. The wider the display the more stereo signal is present. For mono signals it will display a single petal (vertical when panned to center) or leaning to one side (L or R) when panned. For stereo signals the goal is to keep the 'flower' within the central sector delimited by the L and R safety lines. If the 'flower' is wider than the central sector, it means that the Left and Right channels are out of phase, i.e. they will cancel each other out when they are mixed together (on a phone's mono speaker). This can sound heavily distorted. Its bad, don't do it!
- Correlogram - The graph in the top left corner is a correlogram. It shows interference between left and right channels. Two parallel lines means that the Left and the Right channels are in phase. If you see that lines have crossed and the gap between them is filled, the channels are out of phase. If channels are out of phase it means when the Left speaker is pushing, the right speaker is pulling, which will cancel out to a weak sound, lacking bass, if the audio is mixed to mono.
- Balance - The small white dot running around the arc is the balance indicator. It shows how the audio power is distributed between the Left and the Right channels. On the master channel, normally, you would want to keep the balance in the center when the whole mix is playing.
NOTE: The information above is advice, its not RULES! Sometimes you need to ignore advice to achieve artistic goals. Most importantly, you need to learn what sounds good, and how that relates to what you see on the display. Eventually, you will know what to look for, or watch out for.
Pitch
This is a Monophonic pitch tracker similar to the Tuner module. In this case a rolling-history of detected pitches is displayed.
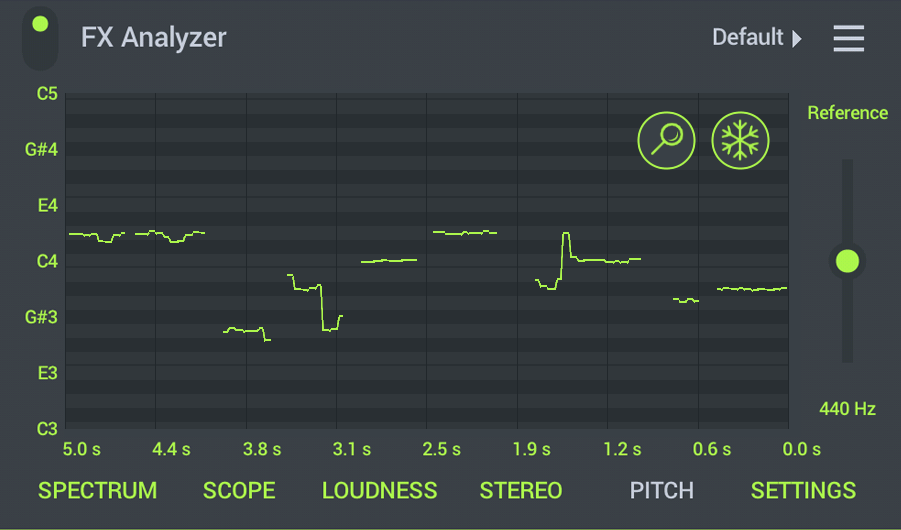
NOTE: This does not work with complex polyphonic musical material. It is best suited to monophonic sounds.
- Reference - Change the Tuning reference from the default A440 Hz.
Settings
These are global settings.
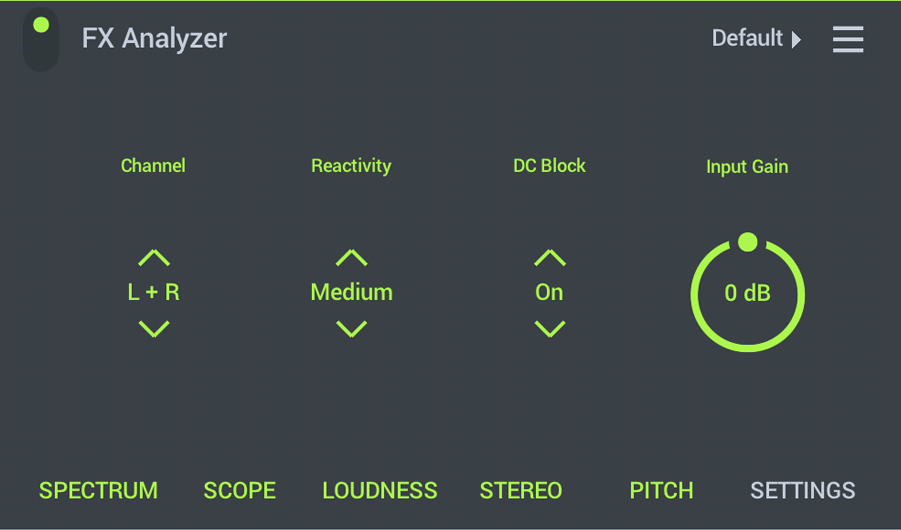
- Channel - Choose the Left + Right, Left or Right channel to monitor. Most display modes are Monophonic, and so only one channel is needed to create the visualization. Try selecting a single channel when displays appear less stable or glitchy.
- Reactivity - How quickly various visualizations respond to the input signal.
- DC Block - Filters out DC offset to the input signal. DC offset is where the waveform averages above or below the 0 dB line, is offset from it. DC offsets can interfere with various algorithms used in the visualizer.
- Input gain - Input level. Increase where you are trying to visualize a weak signal.